
Imbalanced datasets resampling techniques
Published:
This post introduce machine learning techniques to overcome imbalance datasets with resampling methods.
Motivations
This project is neither a part of my curriculum nor of my internship. In my free time I have been reading topics related to data science and learning new algorithms and computer programming languages. One of my favorite data science platform is Kaggle. There, competitions are launched and people vote for the most useful kernels, through these kernels we can learn a lot. One can also find a lot of datasets for personal training.
Last saturday, I read AnkitJHA kernel on IBM HR analytics employee attrition and performance dataset. He compared some popular classifiers in scikit-learn using accuracy, confusion matrix and ROC curve. Good performances were obtained for some algorithms, but it turned out that the dataset is imbalanced, which means that a lot of algorithms classified instances to the majority class. The author said he will come up with some methods which outcome imbalanced datasets.
As you may guess, I didn’t wait for him to come up :) :’Don’t wait for answers coming to you, find them’. I had first googled ‘imbalanced datasets’ and found an interesting article that I recommend if you are interested in, then I searched modules which implement methods of handling imbalanced datasets, and I found this. Please note that methods descriptions that I will present later, and some information (advantages and disadvantages of methods) are taken from these references. Also note that I will use results obtained by AnkitJHA to compare with my results, thereby I took some functions from his kernel. The code (in Python) of this article is available here.
Abstract
The goal of this project is to say either using resampling methods could decrease or increase misclassification of the minority class. I used 3 families of resampling methods for the experience: under-sampling methods, over-sampling and the combination of both. Accuracies and confusion matrices of resampled datasets were compared with the original dataset by using Logistic regression, SVM, KNN, and K Means algorithms. For each family the best method (highest accuracy on average) is selected and the corresponding confusion matrix was compared with the best method obtained with the original dataset. The misclassification of class 1 (minority class) to 0 (majority class) on the original dataset with the best algorithm is 13%. By using resampling methods it increases by 1% for under-sampling, decreases by 6% for over-sampling and decreases by 12,32% with the combinaison of the two methods. So I found in a method dealing with imbalanced datasets that gives good performances(accuracy) and less misclassification.
Introduction
The problem of imbalanced datasets is predominant in scenarios where anomaly detection is crucial like electricity pilferage, fraudulent transaction in banks, identification of rare diseases. It can be overcome with some methods like resampling. The later kind of methods can be categorized into 3 families: under-sampling, over-sampling and both. I took 3 methods either for under-sampling and oversampling and 2 for the last one. The goal of this project is to say either using resampling methods on imbalanced datasets could improve the performances of some classification algorithms. The plan of this article is follow:
First I will describe the original data, then some resampling methods I found, after that I’ll present results I obtained by computing performances of resampled datasets and comparing them to those obtained with original data. And finally, I will compare the confusion matrices corresponding to the best method of each family of resampling methods described with the one obtained with the original dataset.
Data
The dataset is fictional and provided by IBM. It uncovered the factors that lead to employee attrition, contains 35 columns, and 1470 instances. After encoding Attrition(yes, no) to integer (1,0) which is used as target column, only integer data type (27) were kept for both experiences. For more details about the dataset please see here.
The scatter of the first 2 columns (after scaling) is follow:
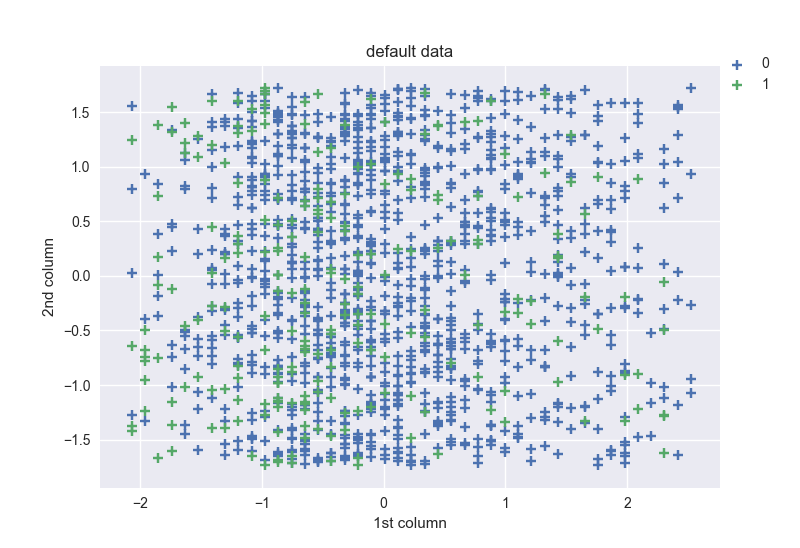
I’ll compare this figure to those obtained with resampled data.
Imbalanced datasets
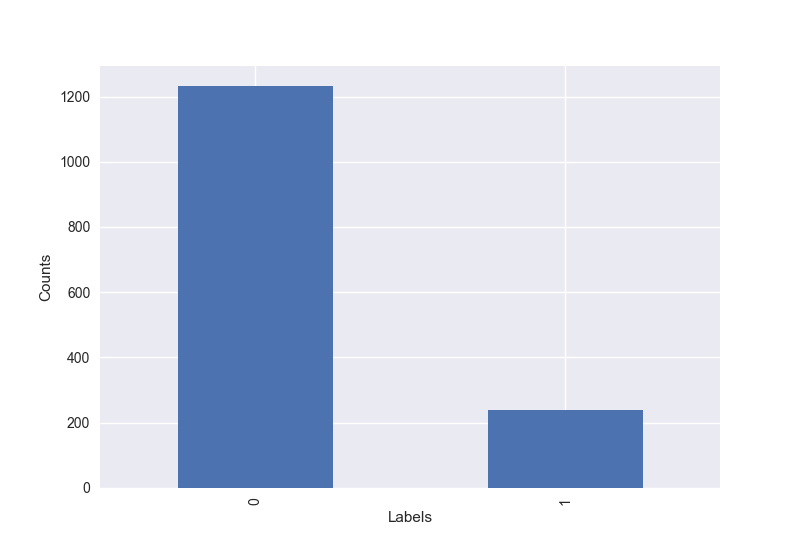
A dataset is said to be imbalanced if the minority class is heavily outnumbered by one or more classes. For example: If classification labels are 0 and 1 and the dataset contains 1000 samples respectively 10 for the 0 class and 990 for 1’s. It’s imbalanced.
It’s the case for our dataset as we can see on the figure below.
Methods descriptions
Note that only some advantages and disadvantages are presented for methods.
Under-sampling:
Given an original data set S, prototype generation algorithms will generate a new set S’ where |S’| < |S| and S’ not in S. In other words, prototype generation technique will reduce the number of samples in the targeted classes but the remaining samples are generated and not selected from the original set. For this family of methods I took center cluster centroids, random under sampling, and all KNN.
Random under sampling
This method is a fast and easy way to balance the data by randomly selecting a subset of data for the targeted classes.
- Advantages: Can improve run time and storage by reducing the number of training data samples.
- Disadvantages: Can discard potentially useful information which could be important for building rule classifiers. Shape of new datasets obtained after resampling by using this method: [(0, 237), (1, 237)], and the scatter of the 2 first columns:
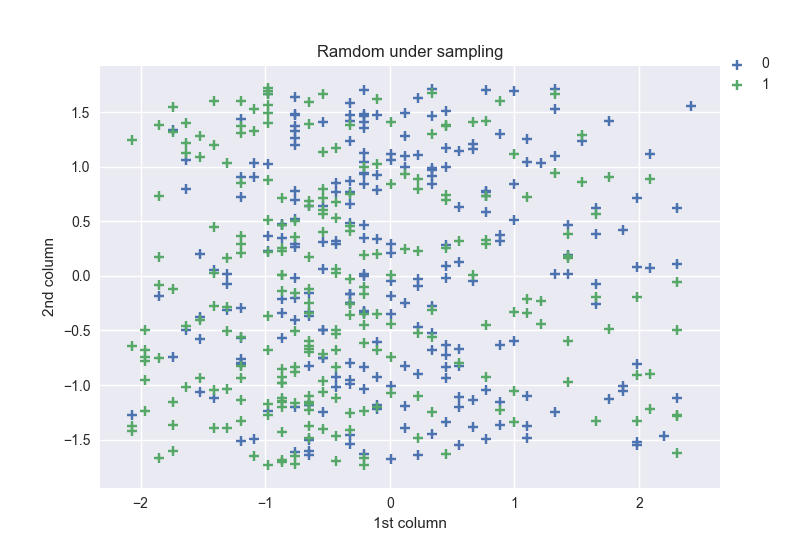
As we can see, the majority class has now the same shape as the minority’s one, and the points on the plot are less dense compared to the original data.
Center cluster centroids
This method makes use of K-means to reduce the number of samples. Therefore, each class will be synthesized with the centroids of the K-means method instead of the original.
Avantages: This clustering technique helps overcome the challenge between class imbalance. Where the number of examples representing positive class differs from the number of examples representing a negative class.
Disadvantages: Possibility of over-fitting the training data.
Shape of new data obtained after resampling by using this method: [(0, 237), (1, 237)], and the scatter of the 2 first columns:
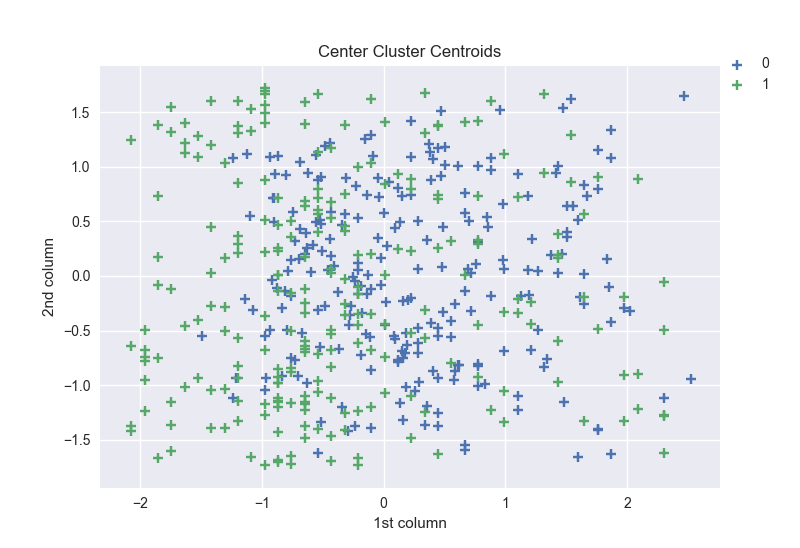
The shape obtained with the new dataset using this method is the same as the one obtained with the Random under sampling. The figures are so close but we can see a little difference on the last column of the x axis of the plot area.
All KNN
Edited Nearest Neighbours applies a nearest-neighbors algorithm and “edit” the dataset by removing samples which do not agree “enough” with their neighborhood. Repeated Edited Nearest Neighbours extends Edited Nearest Neighbours by repeating the algorithm multiple times and All KNN differs from the previous Repeated Edited Nearest Neighbours since the number of neighbors of the internal nearest neighbors algorithm is increased at each iteration.
Shape obtained with new data by using this method: [(0, 776), (1, 237)] and the figure:
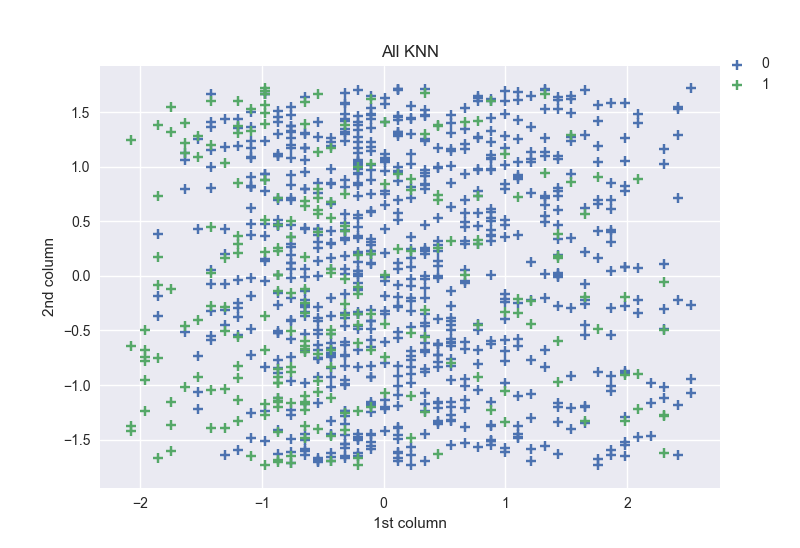
For this method, the shape of the 2 classes are different, the 0 class one’s is more than 3 times greater than 1’s. The points on the plot are relatively dense.
Over-sampling
This family of methods generates new samples in the classes which are under-represented. I took random over-sampling, SMOTE, and ADASYN as methods to test.
Random over-sampling
It generates new samples by randomly sampling with replacement the current available samples.
- Avantages: Unlike under sampling this method leads to no information loss.
- Disadvantages: Increases the likelihood of overfitting since it replicates the minority class events
Shape obtained: [(0, 1233), (1, 1233)] and the figure:
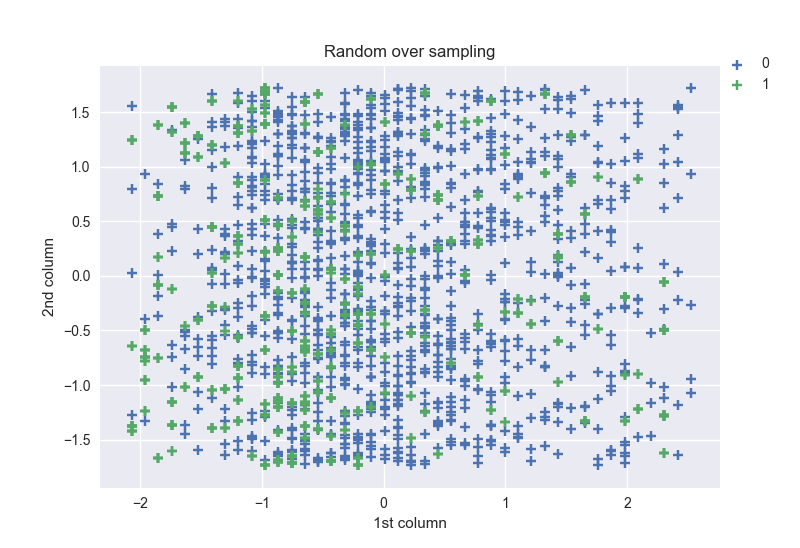
As we can notice, in this case, the shapes for both classes are the same and equal to the shape of the majority class of the original data. The points in the plot are highly dense like in the figure of the original data.
SMOTE and ADASYNS
SMOTE (Synthetic Minority Oversampling Technique) and ADASYN (Adaptive Synthetic Sampling Approach) generate new samples in by interpolation. However, the samples used to interpolate/generate new synthetic samples differ. In fact, ADASYN focuses on generating samples next to the original samples which are wrongly classified using a k-Nearest Neighbors classifier while the basic implementation of SMOTE will not make any distinction between easy and hard samples to be classified using the nearest neighbors rule. Therefore, the decision function found during training will be different among the algorithms.
- Avantages: Mitigates the problem of overfitting caused by random oversampling as synthetic examples are generated rather than replication of instances.
- Disadvantages: not very effective for high dimentional data.
Shapes: [(0, 1233), (1, 1233)] for SMOTE, and [(0, 1233), (1, 1156)] for ADASYNS.
For SMOTE the obtained shapes are the same as those from the previous method. Those obtained with ADASYNS method are relatively different.
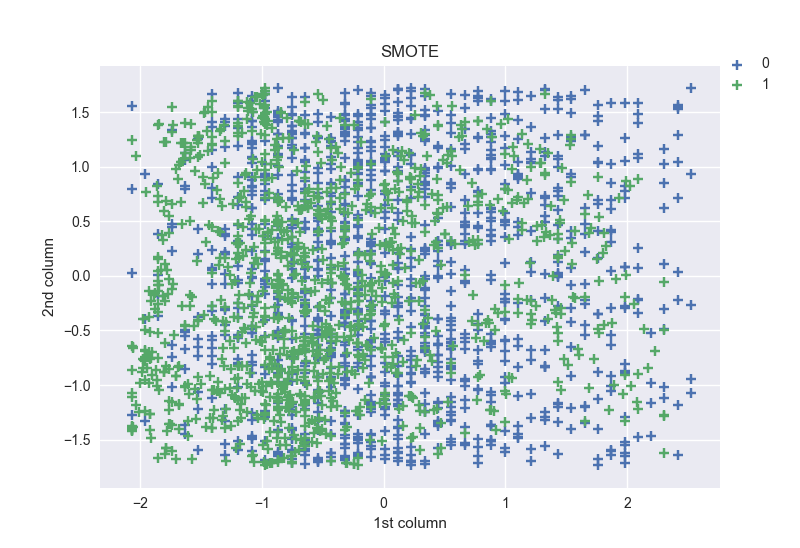
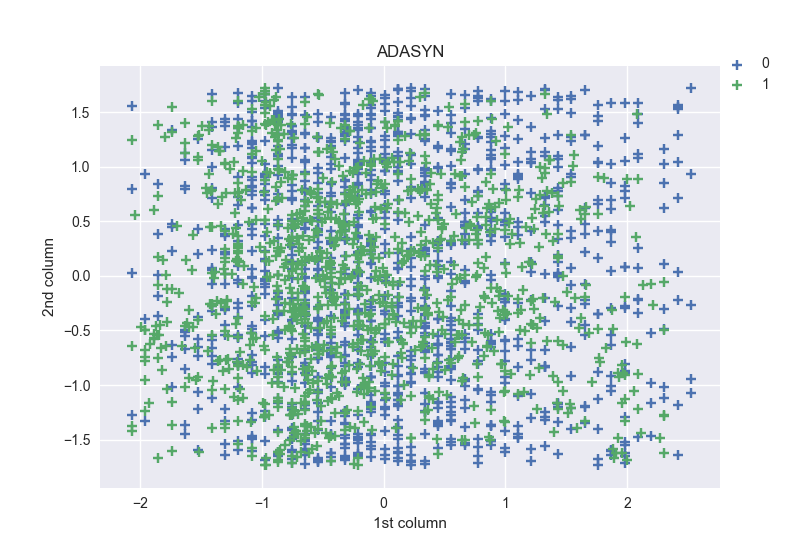
The distribution of points in the plots are highly dense like in with the original dataset.
Over and under sampling
It’s a combination of over and under sampling methods and creates balanced subsets to handle the imbalanced dataset. For this family I took SMOTE ENN and SMOTE TOMEK.
SMOTE generate noisy samples by interpolating new points between marginal outliers and inliers. This issue can be solved by cleaning the resulting space obtained after over-sampling. In this regard, Tomek’s link and edited nearest-neighbours are the two cleaning methods which have been added to the pipeline after SMOTE oversampling to obtain a cleaner space. Therefore, imbalanced-learn implemented two ready-to-use classes which pipeline both over- and under-sampling methods. Shapes: SMOTE ENN [(0, 547), (1, 1208)], SMOTE TOMEK [(0, 1233), (1, 1233)]
We can notice that while the shapes obtained for SMOTE TOMEK are the same for both labels, SMOTE ENN one’s are different. The shape of the label 1 in the later method is twice greater than the 0 label.
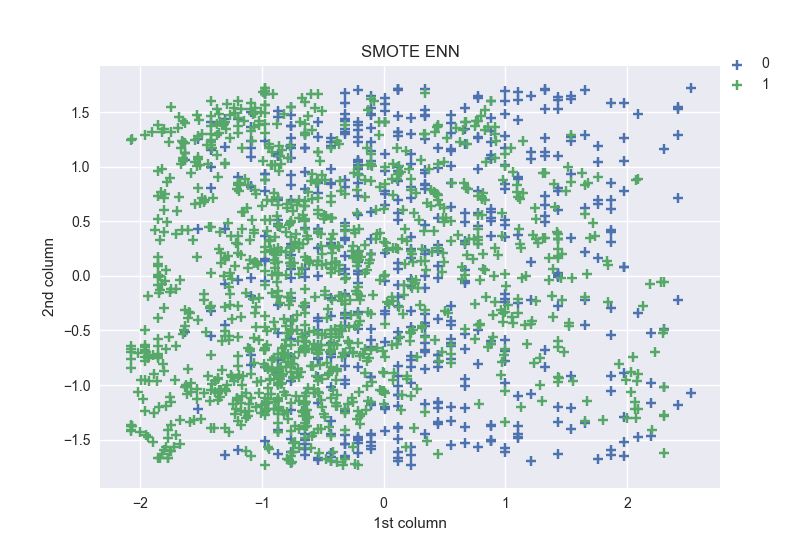
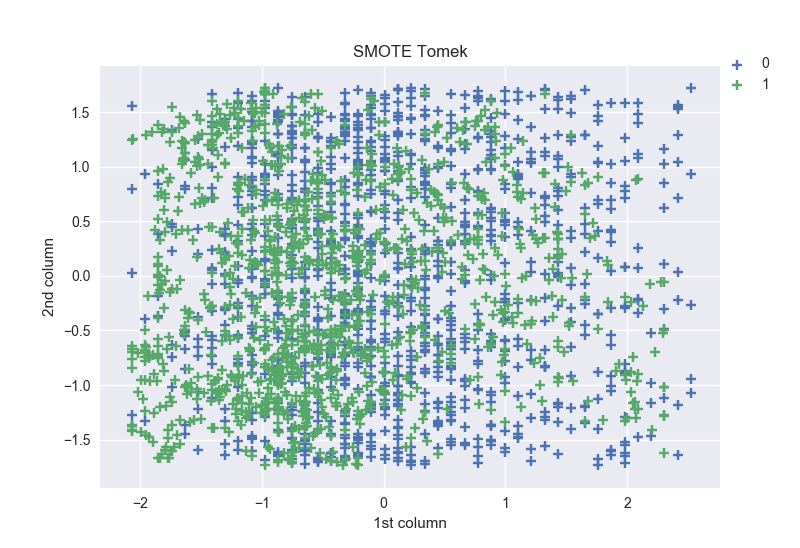
From the two figures, we can notice that the points of label 1 are more concentrated into the left.
Results
In this part, I will compare results obtained with original dataset and those obtained with resampled datasets. I used the same parameters for classification methods, splitting of the dataset into training and testing sets and metrics as AnkitJah.
Results he obtained with original dataset are follow:
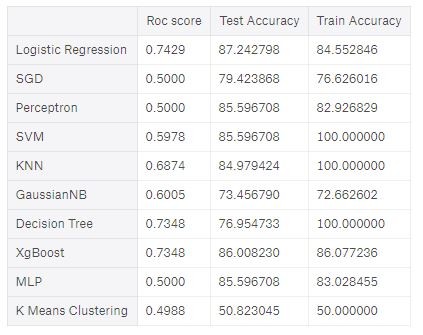
The best scores with both the ROC score and the test accuracy on the original dataset are obtained with Logistic Regression. The classifiers that I kept are Logistic Regression, KNN, SVM and K Means clustering. No let’s see scores obtained with resampled datasets.
Performances with under-sampling methods
For the training set:
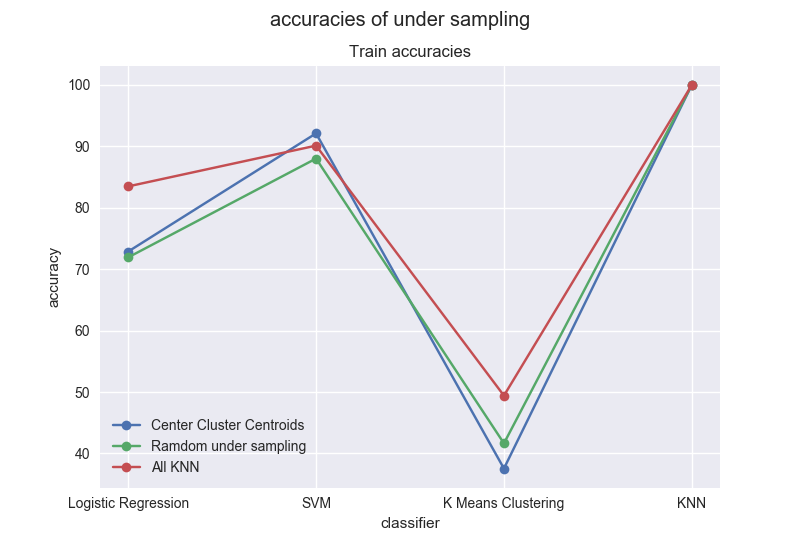
For this set, we can notice that the highest accuracies are obtained with KNN and the lowest with K Means. For all resampled datasets, the accuracy of KNN is 100. All KNN give the best results except for SVM, for under sampling methods.
For the testing set:

On the testing set, once again the lowest accuracies are obtained with K Means. The highest are now obtained with SVM. All KNN is still under the sampling method providing highest accuracies.
Now if we compare results obtained with resampled datasets and original one’s, we can notice that in both experiences, K Means gives the lowest accuracies. With original data KNN and SVM give an accuracy of 100 % on the training set, only KNN gives 100% accuracy on the training set of resampled data and for all under-sampling methods. For the testing set, all KNN and Center Clustering give approximately the same accuracy with SVM as the one obtained with the original dataset.
So with under-sampling methods we can conclude that, All KNN is the one providing the highest accuracies and are obtained with SVM classifier.
Accuracies for over-sampling methods For the training set:
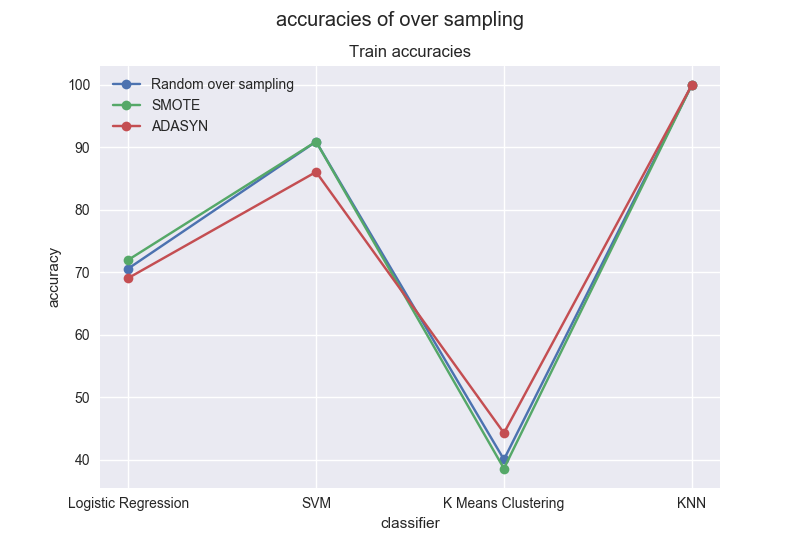
On the training set, we can notice that SMOTE and Random oversampling give approximately the same accuracies for all classifiers. Only K Means gives accuracies under 50% and are lower than the one obtained with original data. Once again KNN gives the highest accuracies for all classifiers. Accuracies with Logistic Regression (LR) are lower than the one obtained on the original dataset.
For the testing set:
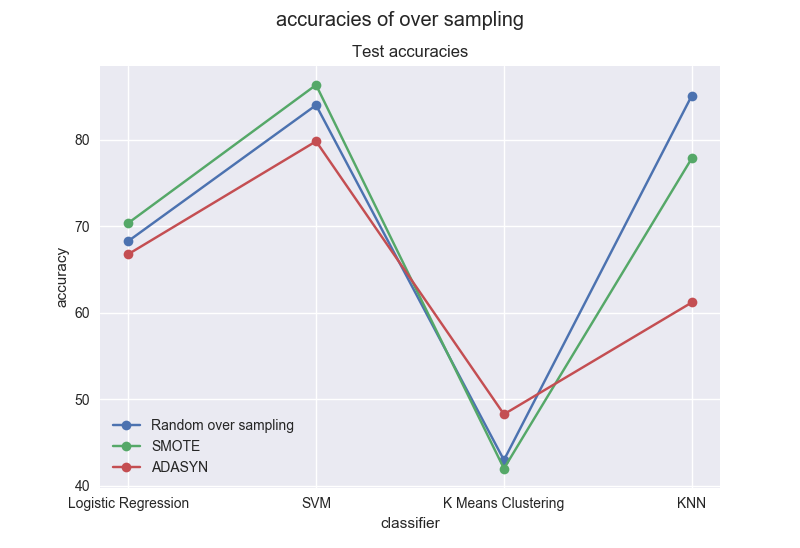
Remarks on this dataset for K Means are the same with those preceding. The highest accuracies on average are obtained with SVM and all are over 75%. For over-sampling methods, we can conclude that on average the best method is Random Over Sampling. Accuracies obtained with LR are lower than the one obtained on the original dataset for both training and testing sets.
Accuracies for over and under sampling methods For the training set: Remarks on this dataset for K Means are the same with those preceding. The highest accuracies on average are obtained with SVM and all are over 75%. For over-sampling methods, we can conclude that on average the best method is Random Over Sampling. Accuracies obtained with LR are lower than the one obtained on the original dataset for both training and testing sets.
Accuracies for over and under sampling methods For the training set:
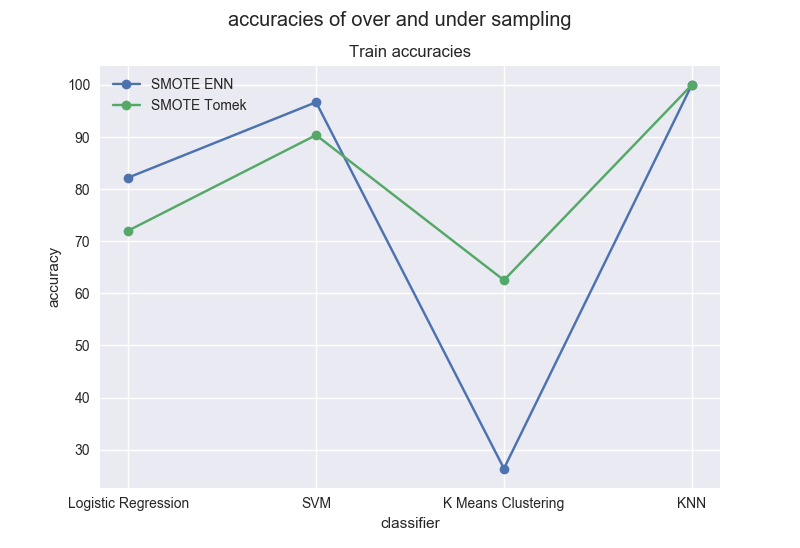
First, we can notice that accuracies obtained with K Means are very different approximately a gap of 30% between the 2 methods. SMOTE Tomek gives the highest accuracies for K Means, and SMOTE ENN for the rest.
For the testing set:

The silhouette of this figure is the same as the preceding. For SVM, the accuracies are greater than the one obtained with the original data for both methods.
So we can conclude that SMOTE ENN gives the highest accuracies for over and under sampling methods except for K Means. For the 3 families of resampling methods, over and under sampling gives on average the highest accuracies. Even good accuracies are obtained with K Means classifier which accuracies were the lowest for the 3 kinds of resampling families.
For under-sampling, the best results are obtained for All KNN method and SVM classifier, Random Over Sampling and SMOTE ENN for respectively over sampling and over-under sampling still with SVM.
Now let’s compare confusion matrices with best resampling methods and with the one obtained with the original dataset.
Recall: the best accuracy obtained on the original dataset is for LR (Logistic Regression):
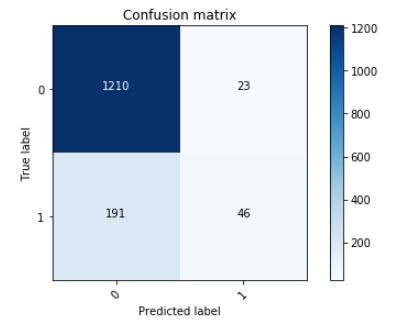
As it was said in introduction, using classification algorithms on imbalanced dataset tend to classifier minority classes to majority one’s. On the confusion matrix of LR, we can see that 191(~= 13%) persons which classes are 1 are classified 0. Now let’s see if using resampling methods decrease this effect.
Confusion matrix with best under-sampling methods Recall: the best under-sampling method obtained is All KNN with SVM classifier. Here is the confusion matrix corresponding:
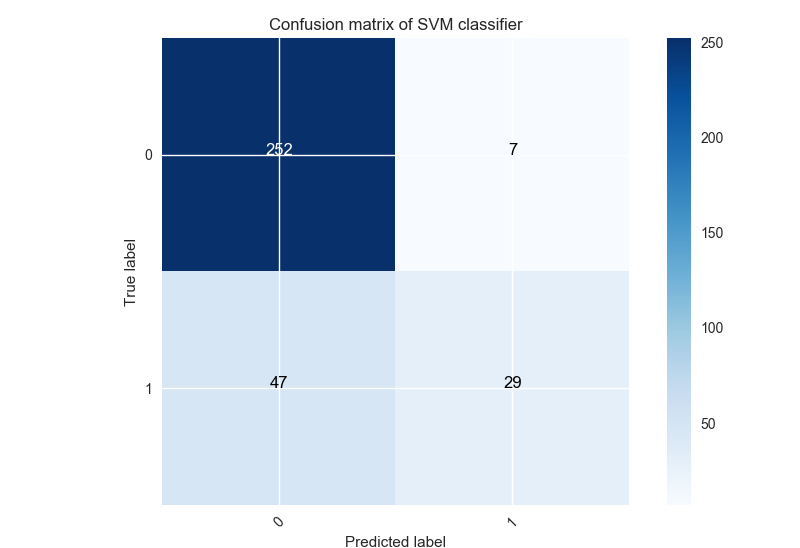
For this method (47 / 335)*100 = 14% of label 1 are classified 0. We have an increase of 1% compared with the original dataset.
Confusion matrix with over-sampling method Recall: the best over-sampling method obtained is Random Over Sampling with SVM classifier. Here is the confusion matrix corresponding:
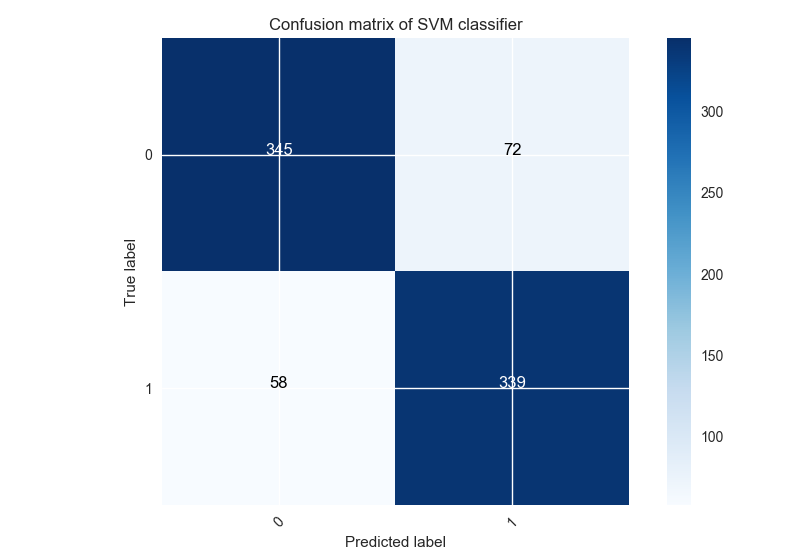
(58 / 814)*100 = 7% label 1 are classified 0 for this method corresponding to a decrease of 6% compared to the original dataset.
Confusion matrix of best over-under sampling methods
Recall: SMOTE ENN is the best over-under sampling method obtained with SVM classifier. Here the confusion matrix:
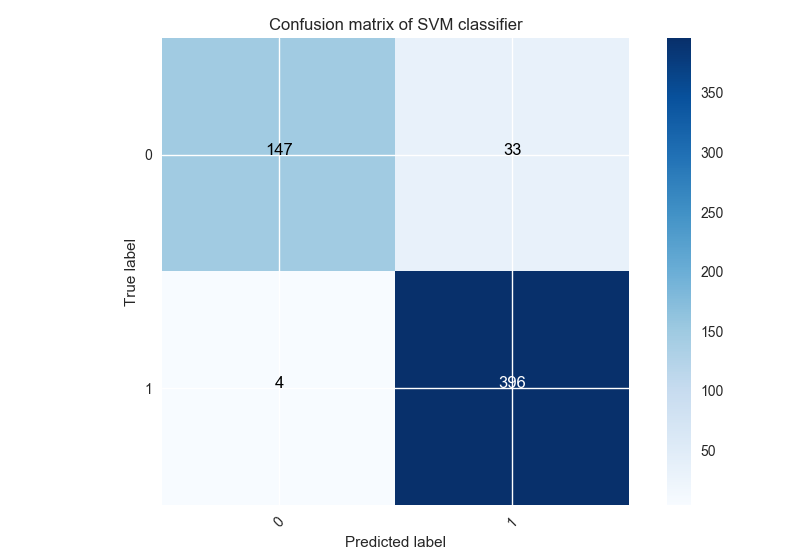
For this method, (4 / 580)*100 = 0.68% of label 1 are classified 0 corresponding to a decrease of 12.32% compared with the original dataset. So the combination of over and under sampling method is the best one which decreases misclassification, then over sampling. Under sampling methods tend to increase it.
Conclusion
The goal of this project was testing resampling imbalanced dataset and comparing results of obtained new datasets with original data and also to say either resampling methods could decrease misclassification or not. I tested 3 families of methods: under sampling, over sampling and a the combination of both. Centrer clusters centroids, random under sampling, and all KNN for the first family, random over sampling, SMOTE, ADASYN for the second and SMOTE ENN, SMOTE Tomek for the last one. The first difference of these families is the shapes of the resampled data, we saw also some differences of dense regions on the figures. I compared the accuracies obtained with resampled data with those obtained on original data by using some classification methods. For the undersampling family, the method which gave the highest accuracies on average is All KNN, random over-sampling with oversampling family, and SMOTE ENN with over-under sampling one’s. Upper accuracies than original dataset were obtained with some methods and lower for others. For the 3 families, lower accuracies were obtained with K Means classifier as on the original dataset. Finally, I compared confusion matrices obtained with the best method of each family to the one obtained with the original dataset. The conclusion of this comparison is that the best family of methods is the combination of under and oversampling, particularly SMOTE ENN, by decreasing the misclassification of 1 label to 0’s by approximatively 95%. The under sampling family method tend to increase this misclassification despite of some good accuracies.
So yes, using some resampling methods could decrease effective misclassification like the combination of over and under sampling methods, but could also increase it by using for example under sampling methods.
This project could continue by comparing some ensemble methods (not presented in this article) of resampling imbalanced dataset with methods used in this project. It could also be interesting to obtain the best method dealing with imbalanced datasets for each kind of data mining problems: regression, clustering, classification ….
I learnt through this project many things that will contribute to my background in data science. The first of all, is curiosity that led me to doing this project, paying attention especially to classes distributions of a dataset before applying algorithms. I finally found a module which I could use for upcoming imbalanced datasets problems.